Explain the causes of a price change
Factors affecting demand (PIRATES)
One cause of a price change is a change in population. When the population increases, this would lead to an increase in the demand for milk, as consumers would be willing and able to buy more milk at each price level, simply because there is now a larger population of people who drink milk. As demand increases, this causes an expansion along the supply curve. This causes the market equilibrium quantity and price to increase to q2 and p2.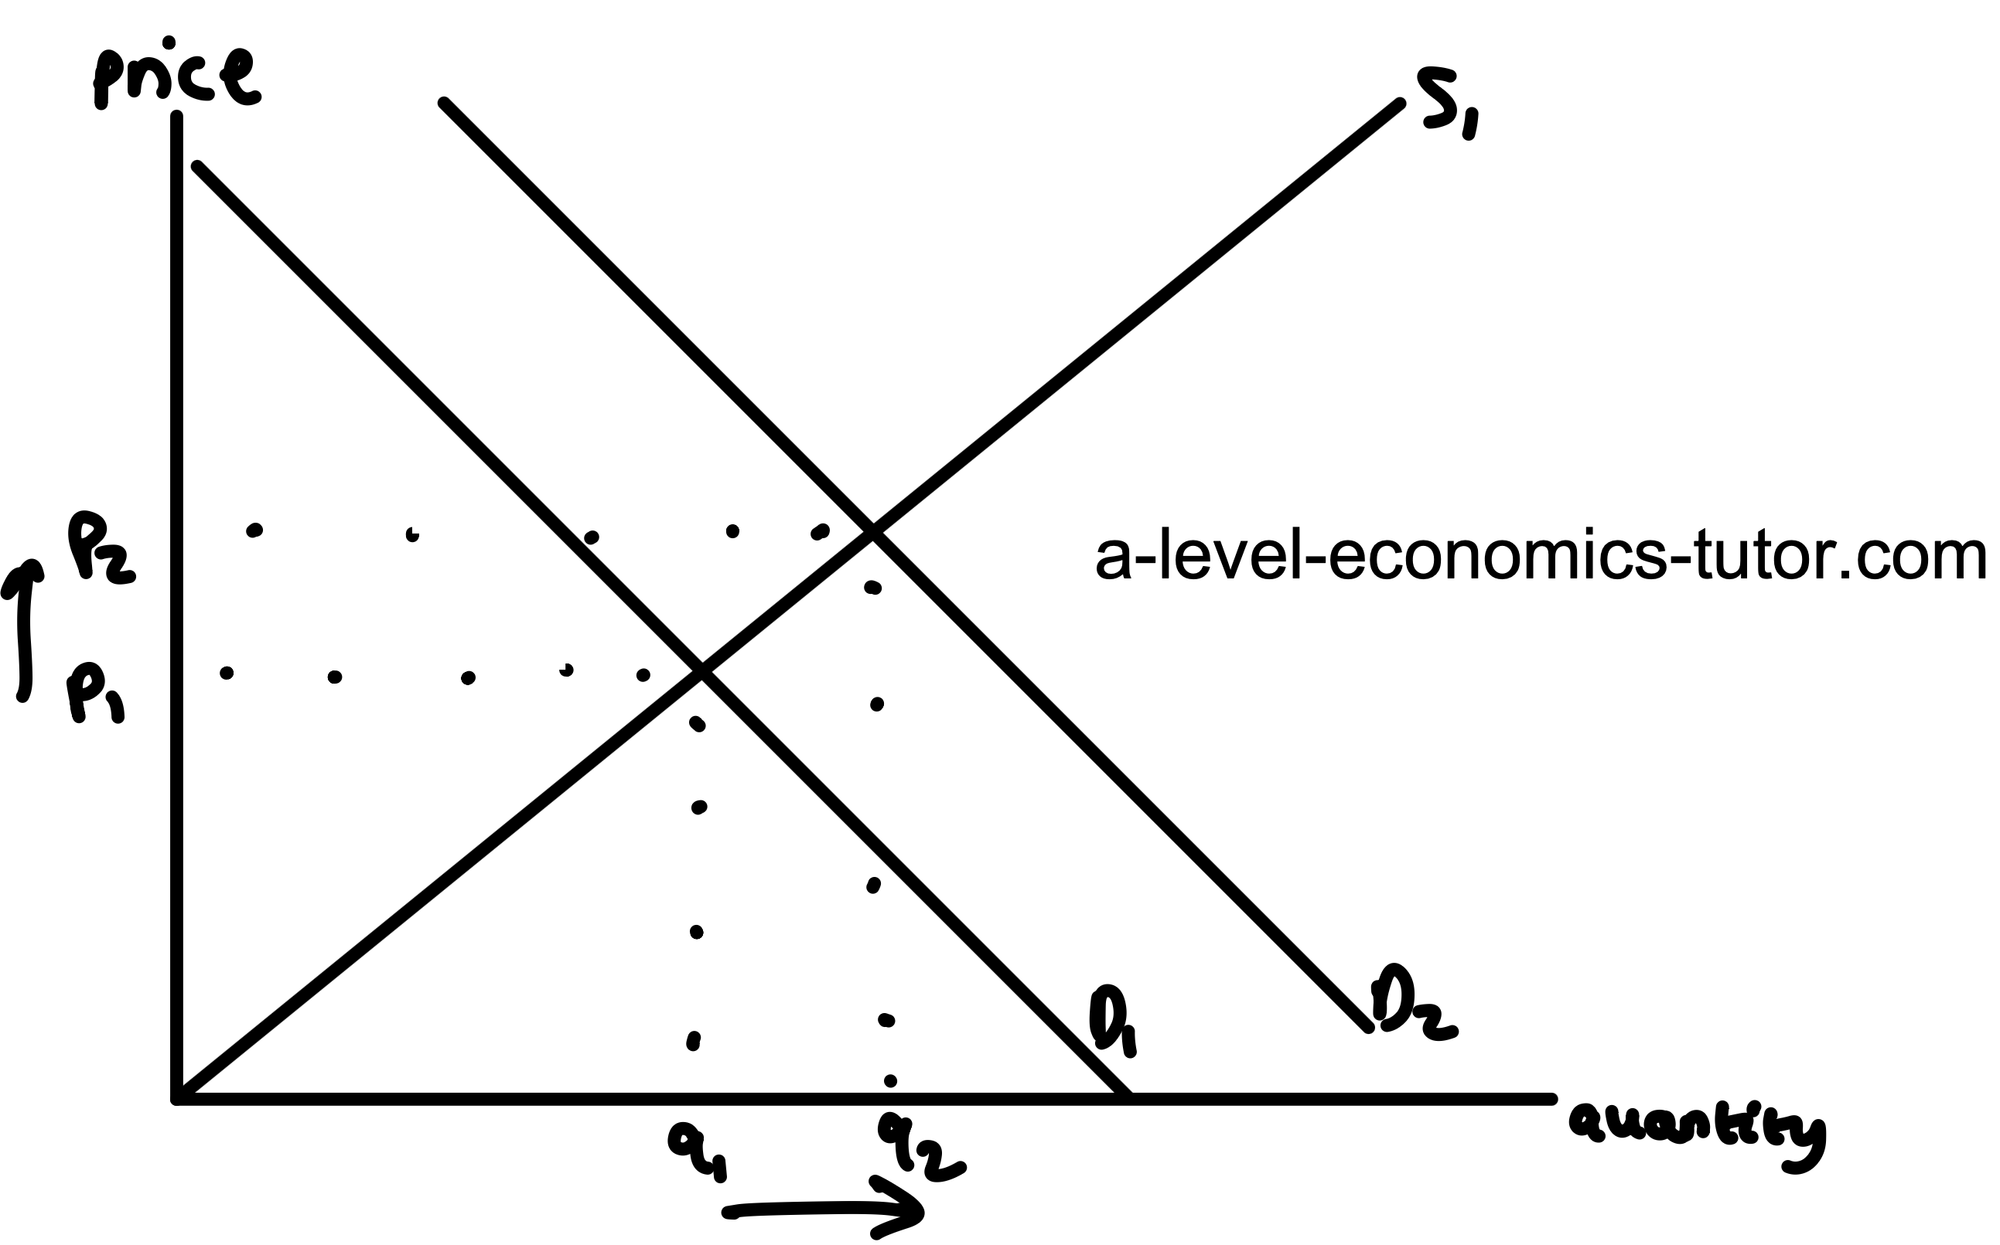
One cause of a price change is a change in incomes. As income increases, demand for smartphones would increase as there would be an increase in the number of smartphones that people would be willing and able to buy at each price point. This is because an increase in incomes allows people to satisfy more of their needs and wants, and demand for luxury goods like newer smartphones will usually increase. As demand increases, this causes an expansion along the supply curve. This causes the market equilibrium quantity and price to increase to q2 and p2.
One cause of a price change is a change in the price of related goods. For example, an increase in the price of matcha could lead to an increase in the price of coffee. As the price of matcha increases, consumers will be more likely to consider switching to alternative goods and services, like coffee. Matcha and coffee are substitute goods, which means they have a positive cross elasticity of demand. An increase in the price of matcha is likely to cause an increase in the demand for coffee as there would be an increase in the amount of coffee that people are willing and able to buy at each price. As demand increases, this causes an expansion along the supply curve. This causes the market equilibrium quantity and price to increase to q2 and p2.
One cause of a price change is a change in advertising. If there was an increase in the advertising for bicycles, or an improvement in the quality of advertising, demand for bicycles would increase as there would be an increase in the number of bicycles that people are willing and able to buy at each price point. This is because the advertising would allow more people to see the value of owning a bicycle. As demand increases, this causes an expansion along the supply curve. This causes the market equilibrium quantity and price to increase to q2 and p2.
One cause of a price change is a change in trends. For example, vapes have become more trendy or fashionable than traditional cigarettes. This means that the demand for vapes would increase as there are a greater amount of vapes that people would be willing and able to buy at each price point. This is because people often make decisions based on social norms and therefore there might be an increase in their perceived value of owning a vape in social settings. As demand increases, this causes an expansion along the supply curve. This causes the market equilibrium quantity and price to increase to q2 and p2.
One cause of a price change is a change in expectations. For example, during lockdown, people formed expectations that supplies like toilet roll would run out due to the news stories they were reading. They may have heard that lockdown would be extended and noticed people rushing to supermarkets. This caused the demand for toilet roll to increase as there was a greater quantity of toilet roll that people were willing and able to buy at each price point. As demand increases, this causes an expansion along the supply curve. This causes the market equilibrium quantity and price to increase to q2 and p2.
One cause of a price change is a change in seasons. For example, the need for certain goods and services like ice cream is likely to change naturally at different times of year. For example, the demand for ice cream would increase during the summer due to the warmer weather, as there would be an increase in the amount of ice cream that people are willing and able to buy at each price point. As demand increases, this causes an expansion along the supply curve. This causes the market equilibrium quantity and price to increase to q2 and p2.
Factors affecting supply (PC TWINS)
One cause of a price change is a decrease in productivity. This means that there is a decrease in output that can be produced despite the same input of factors of production. As a result, firms need to employ more factors of production to produce the same amount of output, which leads to an increase in the cost to produce each unit. This causes a decrease in supply, as there would be a decrease in the number of goods and services that firms are willing and able to produce, at each given price. This would lead to a contraction along the demand curve. This causes the market equilibrium price to increase from p1 to p2, as shown on the diagram below.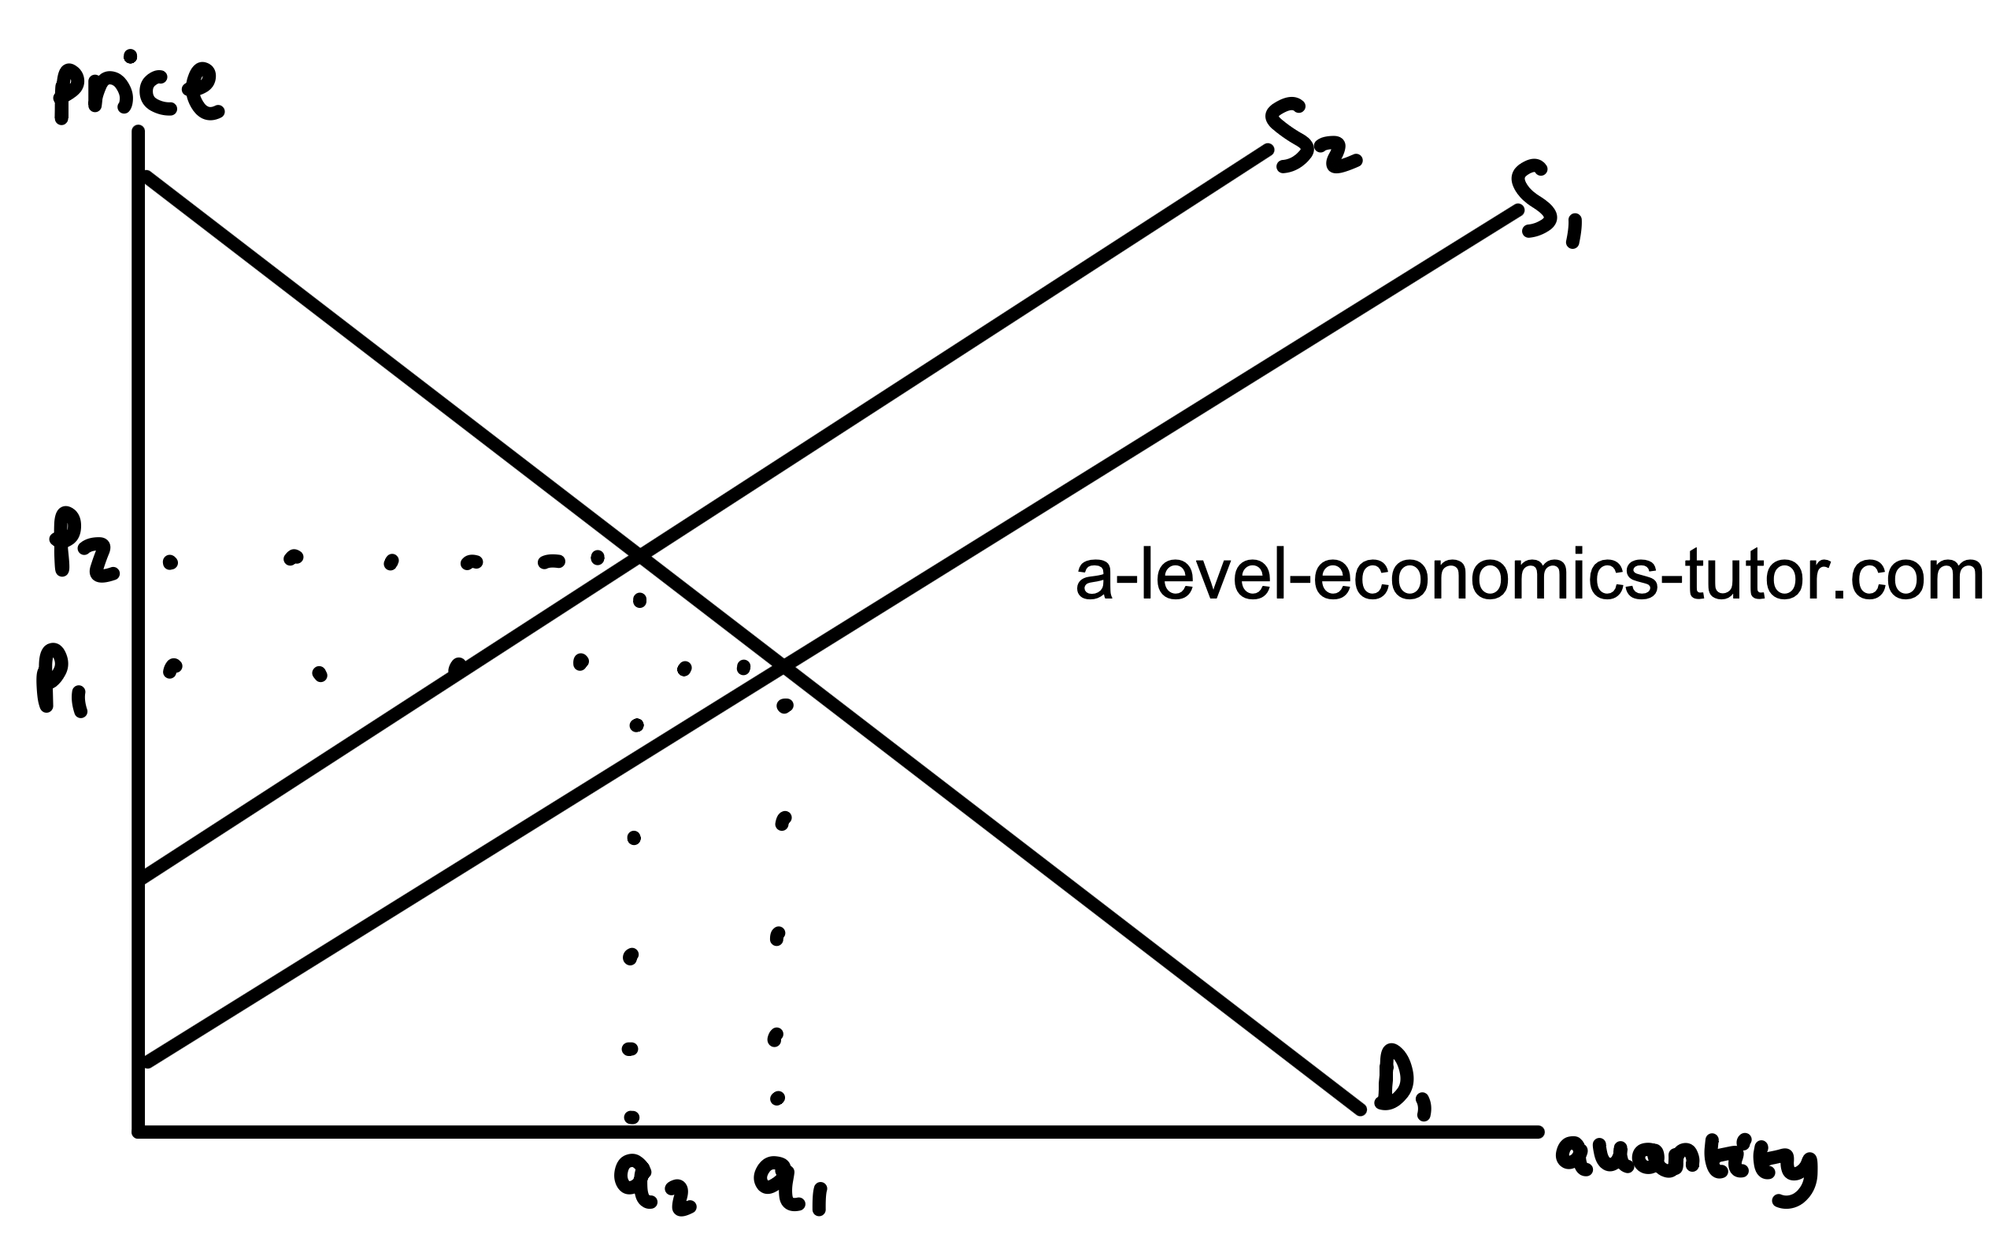
One cause of a price change is an increase in costs of production. For example, higher energy bills would make it more expensive for firms to produce goods and services. This causes a decrease in the profit margin available at each price point. Thus there is a decrease in the incentive for new and existing firms to produce that good or service. This causes a decrease in supply, as there would be a decrease in the number of goods and services that firms are willing and able to produce, at each given price. This would lead to a contraction along the demand curve. This causes the market equilibrium price to increase from p1 to p2, as shown on the diagram below.
One cause of a price change is a change in technology. For example, there could be a decrease in the quality, or an increase in the cost to operate technology such as AI agents, which would lead to an increase in the cost per unit to produce a good or service. This causes a decrease in the profit margin available at each price point. Thus there is a decrease in the incentive for new and existing firms to produce that good or service. This causes a decrease in supply, as there would be a decrease in the number of goods and services that firms are willing and able to produce, at each given price. This would lead to a contraction along the demand curve. This causes the market equilibrium price to increase from p1 to p2, as shown on the diagram below.
One cause of a price change is a change in the weather. For example, poor weather makes it more difficult to produce agricultural goods. This means that farmers are having to work longer hours to produce the same number of goods and services, so cost per unit increases due to firms having to pay more in rent and wages, to produce the same output. This causes a decrease in the profit margin available at each price point. Thus there is a decrease in the incentive for new and existing firms to produce that good or service. This causes a decrease in supply, as there would be a decrease in the number of goods and services that firms are willing and able to produce, at each given price. This would lead to a contraction along the demand curve. This causes the market equilibrium price to increase from p1 to p2, as shown on the diagram below.
One cause of a price change is an increase in indirect taxes. Indirect taxes are costs imposed on firms by the government, meaning firms must pay the government according to each unit they produce. This could be a specific tax, a fixed amount per unit, such as fuel duty, or an ad-valorem tax, a percentage of the price, such as VAT. This causes a decrease in the profit margin available at each price point. Thus there is a decrease in the incentive for new and existing firms to produce that good or service. This causes a decrease in supply, as there would be a decrease in the number of goods and services that firms are willing and able to produce, at each given price. This would lead to a contraction along the demand curve. This causes the market equilibrium price to increase from p1 to p2, as shown on the diagram below.
One cause of a price change is an increase in the number of firms in the market. In the long-run, firms are incentivised to enter a market where existing firms are making supernormal profits, given that the barriers to entry are low enough. This causes an increase in supply, as there would be an increase in the number of goods and services that firms are willing and able to produce, at each given price. This would lead to an expansion along the demand curve. This causes the market equilibrium price to decrease from p1 to p2, as shown on the diagram below.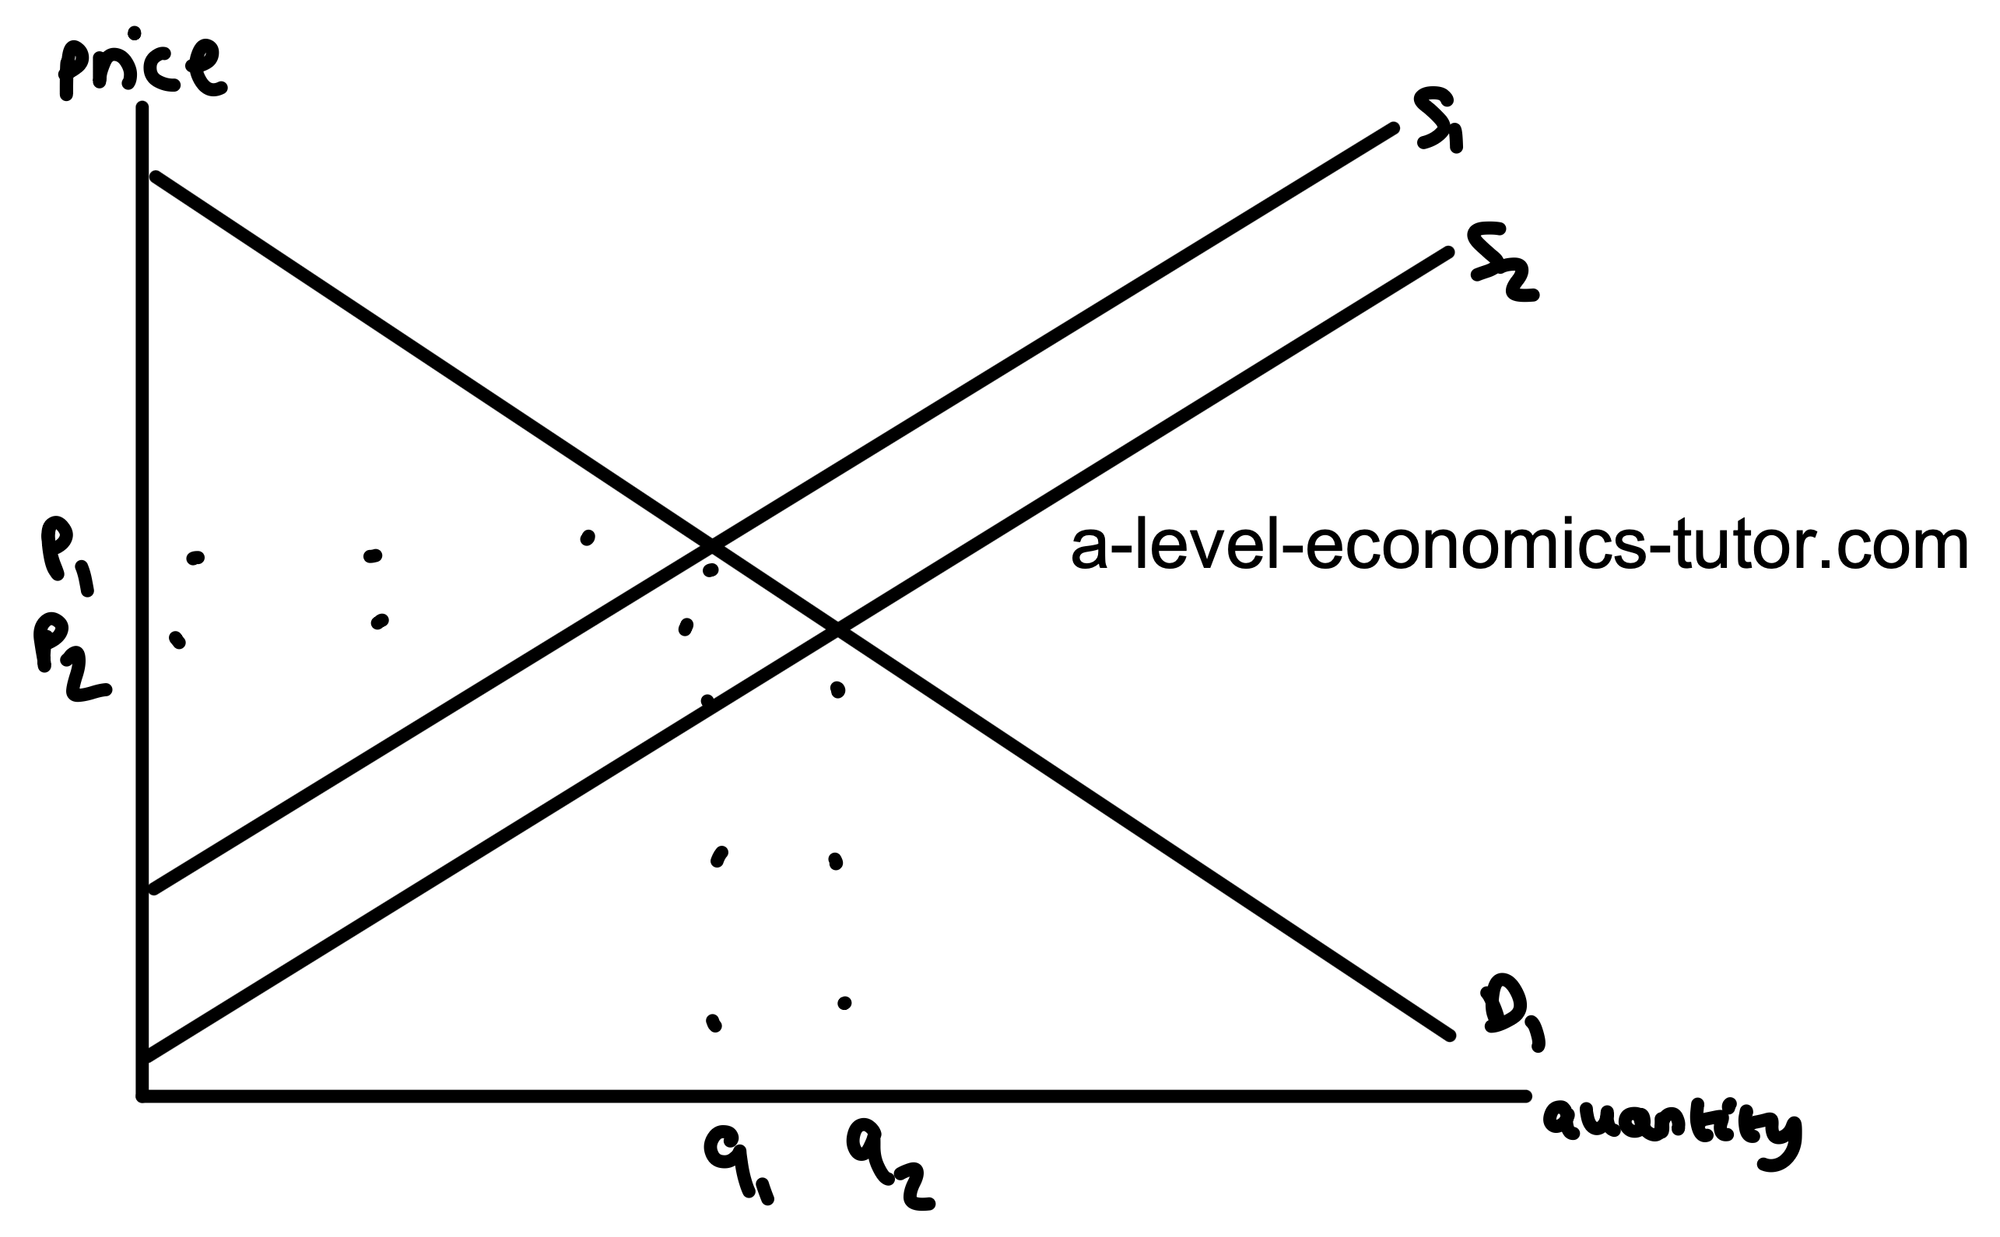
One cause of a price change is an increase in subsidies. Subsidies are payments made to firms by the government. This reduces the cost per unit for firms who are producing the given good or service. This causes an increase in the profit margin available at each price point. Thus there is an increase in the incentive for new and existing firms to produce that good or service. This causes an increase in supply, as there would be an increase in the number of goods and services that firms are willing and able to produce, at each given price. This would lead to an expansion along the demand curve. This causes the market equilibrium price to decrease from p1 to p2, as shown on the diagram below.
A-Level Economics Tutoring
I offer one-to-one and small group A-Level Economics tutoring for students across the UK and internationally. With 87+ five-star Google reviews and tutoring experience since 2017, I specialise in helping students understand difficult concepts and improve their exam technique.